It’s always exciting to make a sale – whether you’re a billion dollar retailer or it’s the official launch of the eCommerce site for your small business. There’s a lot that goes into every sale that we’ll never fully understand – and this blog post isn’t about those mysterious market forces. This post is about what you can track, what you can learn, and why you should care.
What is sales attribution?
In the digital analytics sphere, sales attribution usually refers to how you assign revenue to categories of attribution. Most often attribution refers to “off site” or marketing channel attribution – how the converting traffic arrived on your website or mobile application.
For the purpose of this article, we’ll be focused on two flavours of “attribution” – off site and on site. On site attribution can often be overlooked because we make the assumption that a website is a holistic experience, as opposed to many interlinking parts.
What is off site attribution?
Off site attribution for the purposes of this post refers to traffic driving activities and how you attribute conversions to them. A typical example of a marketing channel under this umbrella would be organic search. A visit is attributed to organic search when a user enters a query into a search engine like Google and ultimately arrives at your site from an organic placement (not through a paid advertisement, typically labeled as an ‘Ad’).

What is on site attribution?
On site attribution for the purposes of this post refers to on site components that facilitate a user’s conversion journey and how you attribute conversions to them. The concept of on site attribution goes a bit beyond things like conversion funnel reports – it takes the pre-existing model of marketing attribution and assigns the same principles to web or mobile application features.
Attribution models
There are several “standard” Attribution Models. A lot of people have done excellent jobs of breaking down the nitty gritty details – I recommend checking out Zapier’s post on attribution here. But generally speaking, the most common are First Touch and Last Touch. This simply means you assign 100% of the value of a conversion to either the first engagement a user had with your site (i.e. they arrived from organic search and then visited again to convert two weeks later) or from the last engagement a user had with your site before converting (i.e. they visited several times from organic search and then clicked a paid advertisement before converting).
A real world example
Continuing my example from the section on off site attribution, I went through the entire shopping and purchase journey on Etsy starting with my keyword “chess board”.
After clicking on one of the Google Shopping results, I’m taken to a product detail page for a chess set. If I inspect the server calls to Etsy’s analytics provider I can see that details about my marketing channel attribution are recorded in the query parameter (AKA the stuff on the URL that comes after the ‘?’). These UTM values (originally Urchin Tracking Module) tell me that my traffic source was Google, the medium was cost per click advertising (or CPC), and the campaign is called “Shopping Canadian English toys & games”. There’s some additional information in there that isn’t “readable” to the outside eye, lots of strings that probably translate into things like creative used, ad position, bids, etc.
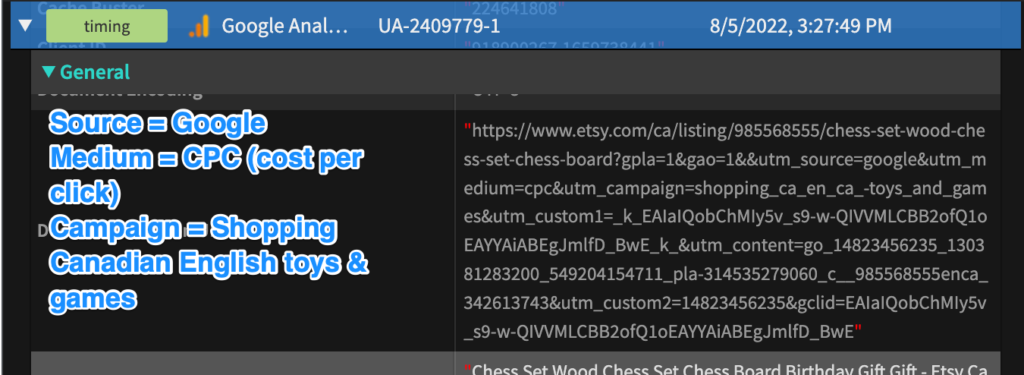
Once I arrive on the Etsy website, off site attribution’s work is essentially completed. If I convert during this session, the revenue that is captured will be assigned to this CPC campaign. Although anyone who has ever worked in the web application or product space knows that this is the very beginning of the user’s journey.

Now that I’m on the Etsy platform, I have lots of opportunities to explore similar products or continue with the purchase journey for the original item I viewed. The above screenshot divides these options visually into a “shopping” and “purchase” journey.
I see a variety of suggested similar items in the algorithmic recommender portion of the product detail page. I spot a 4 in 1 game set with a hinged lid and click it.
Google Analytics now records my interaction with this recommendations component with a few details, including the location of the component and the general recommendation type (“similar_listing”). Once again there are a variety of variables in the query parameter that would tell an internal Etsy employee more about the significance of this click, including any influence on real time, user-item recommendation algorithm(s).
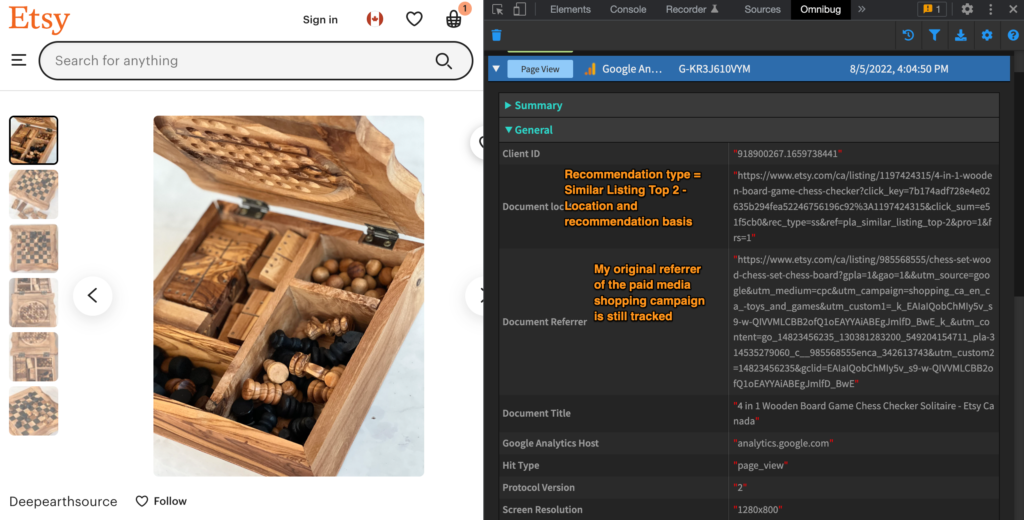
Seeing this neat chess board with a folding top makes me realize what I’m actually looking for – portability. So I use the search bar to look for a “travel chess set”.
After conducting my search, I’m brought to the search results page (or SERP).


I feel satisfied I’ve found the best option for my purchase, so I click “Add to Basket”. This fires the AddtoCart event and sets some amount of info associated with my shopping behaviour so far with this individual item or “product_id”.

This is important – because not only can this item remain in my cart and I could return to purchase it later, but I could also add additional items that would have inherently different on site paths for conversion. (But we’ll keep things simple for now.)
Once I reach the final stages of the purchase decision and begin the checkout process, I get one more interaction with a conversion driving component: some urgency messaging prompting me to complete my order before the promotion ends.

Putting it all together
The diagram below sums up the real world example detailed above. I had 4 interactions along the course of my shopping & purchase journey with Etsy: one off site, three on site. I viewed three products, each discovered via different means (Paid Search, Product Recommendations, and Internal Search) and I purchased one product. I engaged with one urgency messaging component while in the checkout process. Etsy made a sale worth $65. But how and where do we attribute that revenue?
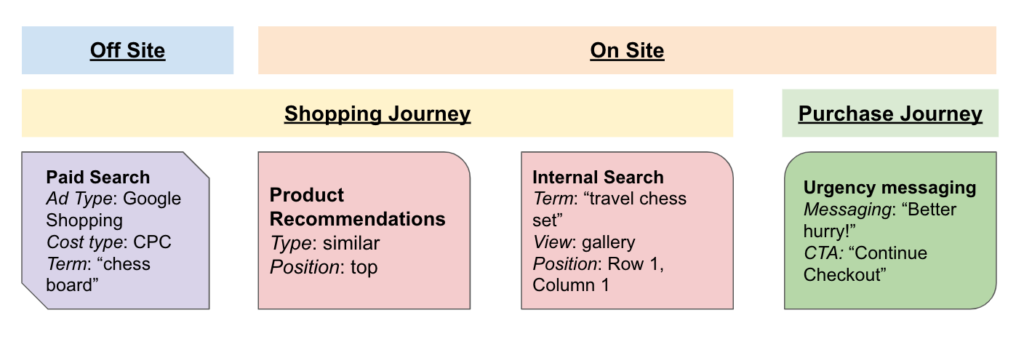
As noted in the section on Attribution Models, there are multiple established ways of viewing attribution. In a classic marketing channel attribution approach (only concerned with off site attribution), Paid Search would get 100% of the $65 conversion attribution. Regardless of whether you used First Touch, Last Touch, or any other attribution approach, because my journey only involved one visit to Etsy’s site, Paid Search is our only path.
On site attribution can be viewed in a similar way. If we’re concerned with only the Last Interaction prior to my Cart Add action and initiating my purchase journey, then 100% of the $65 conversion attribution would be assigned to Internal Search (this model would be most similar to “Last Indirect Click“). Alternatively, we could use a Linear model and split the value equally between the four interactions – $16.25 is attributed to each.
Regardless of the approach taken or the model leveraged, you likely already have all the data that you need to begin attributing revenue to on site features. This work might need to be done manually initially through data exports, linking sessions with orders and their respective interactions. In Adobe Analytics, merchandised variables can simplify and automate this type of reporting.
Takeaways and next steps
So you’ve read some or all of this very long post about on site sales attribution – now what? I’d recommend taking three things away to enhance your personal understanding of analytics or your company’s analytics practice.
Marketing channel/off site attribution is one part of a larger story
Your user’s journey doesn’t end when they arrive on your website, so why should your reporting? Don’t allow organizational “walls” that may exist between marketing departments that analyze and allocate spending on traffic acquisition and digital analytics departments that analyze site conversion and performance stop critical conversations from taking place. Experiment with custom models, examine the relationship between channels and on site component engagement, and start forming holistic hypotheses.
Don’t put your head in the sand regarding technical and privacy legislation impacts to off site attribution reporting
“Change is the only constant” may be a cliche, but it’s not untrue. Privacy legislation will continue to proliferate. Web browsers will continue to increasingly offer built-in, always on, enabled by default privacy as a feature. These changes are already impacting the viability of your multi-channel attribution reporting. You can play a cat and mouse game of attempting to circumvent these technical limitations, but this won’t be a sustainable approach in the long run.
If you’re looking for opportunities to optimize, your users are already giving you a lot of in-session signals. Ongoing analysis of the relationship between traffic source and on site behaviour can yield a wide variety of potential hypotheses. If you aren’t already delivering personalized experiences to users based on their on site behaviour, now is an excellent time to start experimenting. Functional, first party tracking isn’t going anywhere any time soon – invest time and resources into making the most of it.
If you aren’t analyzing on site sales attribution you are not maximizing your investment in your web, digital, or product analytics tools
Does the entirety of your reporting from your digital analytics data look like this?
| Marketing channel | Bounce rate | Conversion rate | Revenue |
| Paid search | 60% | 2.3% | $1.5m |
| Organic search | 75% | 4.2% | $2m |
| 40% | 6.1% | $500K |
If so, you’re missing out on a lot of valuable insights you could likely be deriving without any updates to your analytics implementation. Consider the below table compared to the above – what additional insights might you be able to intuit from this data?
| Marketing channel – On site component | Engagement rate | Conversion rate | Revenue (% of total) |
| Paid search | – | 2.3% | $1.5m |
| – Recommendations | 30% | 1% | $200K (13%) |
| – On site search | 50% | 4% | $1m (66%) |
| – Category detail page (CDP) | 20% | 2% | $300K (20%) |
From the first table, we know that paid search generated $1.5m in revenue for the period with a 2.3% average conversion rate. Not much actionable information there without some trended data or information on return on paid media investments. Beyond that, as someone working on the web application or on a product team, I don’t have much to go on.
In the second table, we have a lot of additional insight about paid search performance. We know the breakdown of total engagements with on site components and their respective conversion rates and revenue. Immediately we can see that recommendations are driving a disproportionately lower amount of total revenue and a lower conversion rate.
Consider the Etsy example again – recommended products were very prominent on the landing page. If this was a report on Etsy’s performance, we might hypothesize that there’s an issue with these recommendations. Why are users converting so comparatively poorly despite a 30% engagement rate? If we know that on site search performs so well for traffic from paid search, should we adjust the prominence of that component compared to recommendations? Or is this behaviour simply more common for a user who is browsing and less likely to convert? All of these are interesting, provocative questions generated by a single table of data that combines off site and on site sales attribution.
Thanks for reading and I hope you found this helpful. If you have a question, let me know in the comments.